Case study /09 · Delivered
CAEX Pollution Intelligence
Context
Mining haul trucks (CAEX vehicles) continuously report position and emissions-related telemetry. Regulation and internal policy define thresholds; operations teams need to react while a shift is running, not in next week's report.
Problem
The dataset is large in two dimensions at once — many vehicles updating frequently, across long route networks with dense historical readings. The interface had to render both live movement and threshold-colored route history without stuttering.
Constraints
- Telemetry arrives continuously; the map could never block on a full refresh.
- Route segment coloring had to reflect configurable pollution thresholds exactly — this drives operational action.
- Time-based filtering needed to slice large histories interactively.
- Dashboards run all day on control-room screens; sustained memory behavior mattered as much as peak FPS.
Responsibilities
- Real-time map architecture and rendering strategy.
- Moving vehicle visualization with smooth interpolation between telemetry points.
- Route segmentation and threshold-based coloring pipeline.
- Time-range filtering over large geospatial datasets.
- Operational dashboard views combining map, KPIs and alerts.
Architecture
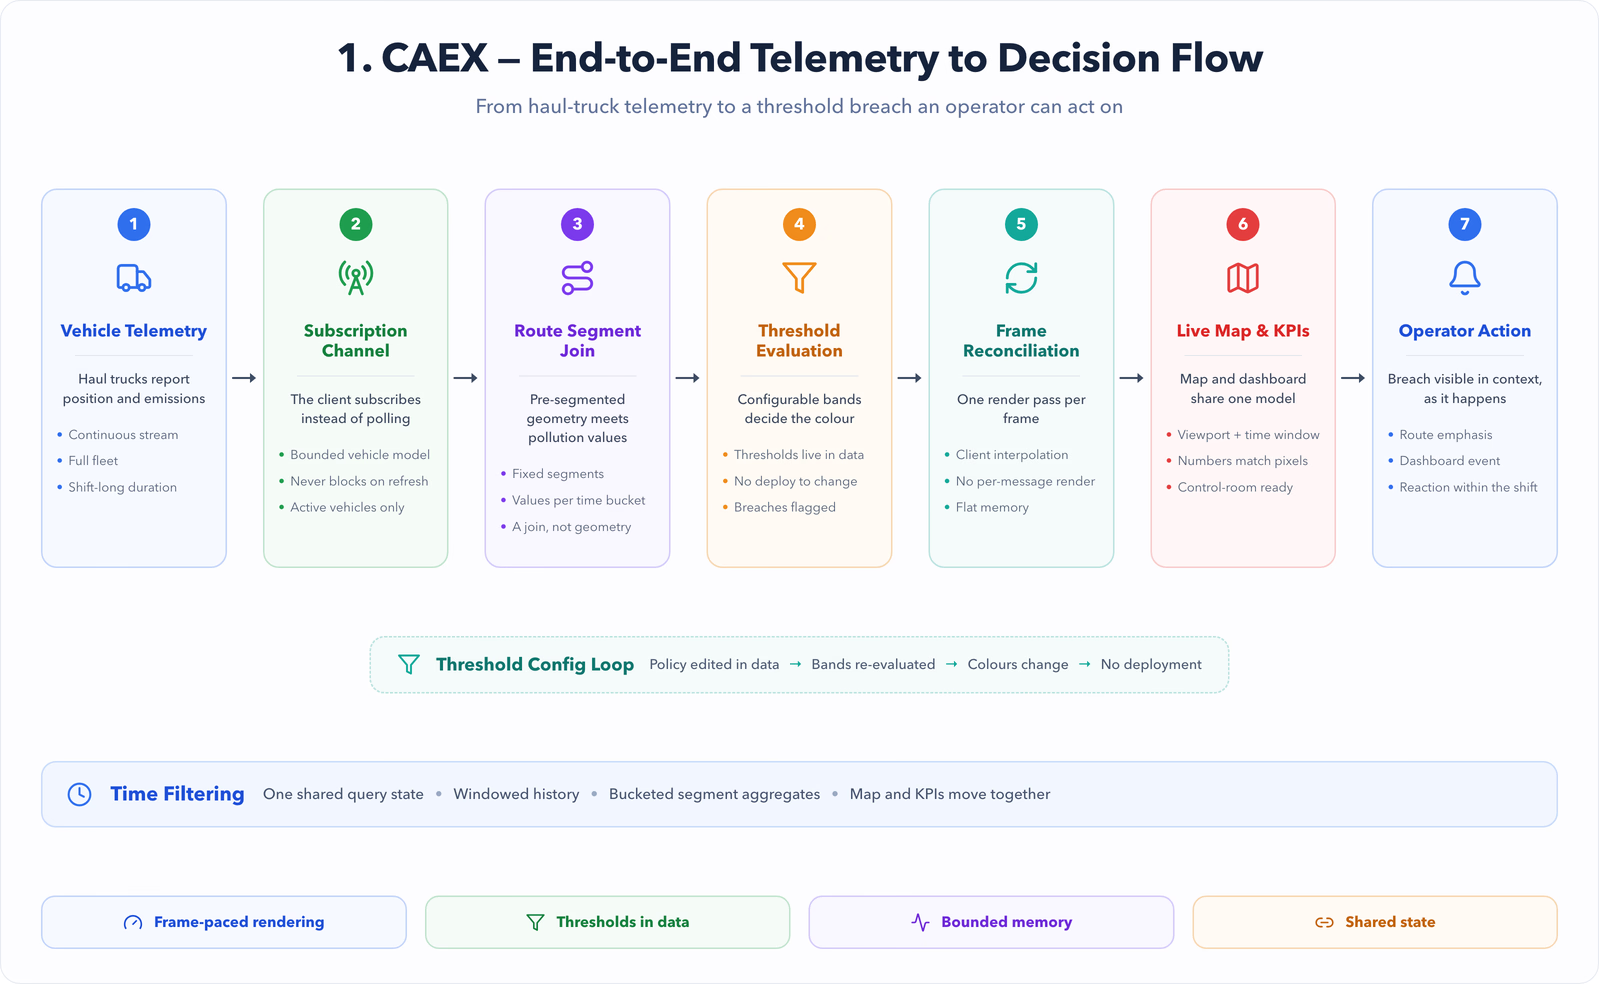
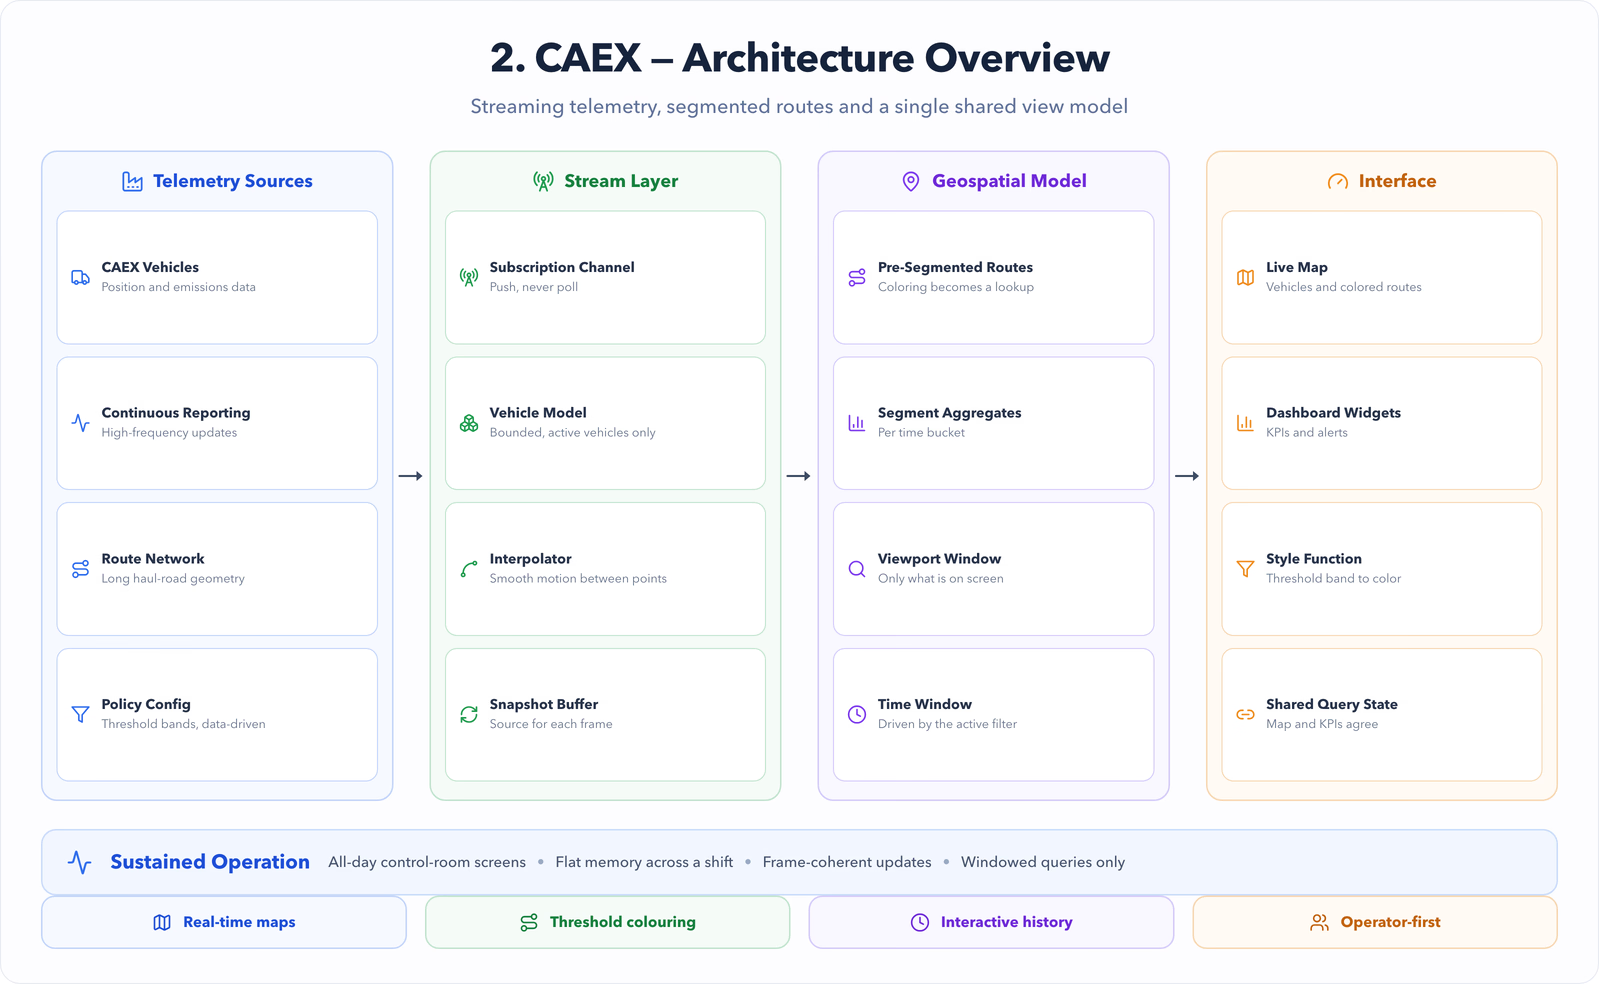
- Telemetry streams into the client through a subscription channel; the map maintains a bounded in-memory model of active vehicles and visible route segments.
- Route geometry is pre-segmented so pollution values map to fixed segments — coloring becomes a data join, not a geometry recomputation.
- Historical queries are windowed by the active time filter and viewport, never loaded wholesale.
- Dashboard widgets subscribe to the same vehicle model as the map, so numbers and pixels can't disagree.
Key decisions
- Interpolate vehicle motion client-side between telemetry points — smoothness comes from animation, not higher-frequency polling.
- Precompute segment-level aggregates per time bucket so threshold coloring over a day of data is a lookup.
- Cap simultaneously rendered history by zoom level, mirroring how operators actually inspect: wide view for patterns, close view for detail.
- Keep threshold configuration in data, not code, so policy changes don't require deployments.
Implementation
- A render loop reconciles vehicle positions once per frame from the latest telemetry snapshot, avoiding per-message re-renders.
- Route segments carry pollution values per time bucket; the active filter selects the bucket and the style function colors by threshold band.
- Time filtering drives both map layers and dashboard aggregates from one shared query state.
- Alerting surfaces threshold breaches as both map emphasis and dashboard events.
Performance
- Bounded vehicle and segment models keep memory flat across a full shift of streaming data.
- Viewport + time windowing keeps geospatial queries proportional to what is on screen.
- Frame-coherent updates (one reconciliation per frame) eliminated telemetry-driven jank.
Outcomes
- Operations teams monitor pollution generation live instead of reconstructing it after the fact.
- Threshold breaches are visible on the route itself, in context, at the moment they happen.
- The rendering approach held up against the full fleet and route network it was designed for.
- [PLACEHOLDER — add fleet size and data-volume figures here if publishable.]
Lessons
- In monitoring UIs, predictable frame pacing beats raw feature count.
- Pre-segmenting geometry converts a rendering problem into a data problem — the cheaper kind.
- Operators trust interfaces that agree with themselves; shared state between map and KPIs is a correctness feature.
Software Architecture