Case study /07 · In production
CLZTR
Context
Discovery apps mostly show static listings. CLZTR's bet is that a city feels different when you can see it move: events appearing as they are published, crowd presence shifting through the evening, and clusters forming around neighborhoods as activity concentrates.
Problem
A live map is brutally demanding. The client must render large volumes of geospatial data at interactive frame rates on mid-range phones; the backend must answer viewport queries in tens of milliseconds and push presence changes to every relevant client without flooding the network.
Constraints
- Mid-range Android devices as the performance baseline, not flagships.
- Real-time presence had to degrade gracefully on unstable mobile connections.
- A solo-founder budget: infrastructure had to stay simple enough for one person to operate.
- Event volumes spike sharply around weekends and large happenings — the quiet-day architecture had to survive the loud days.
Responsibilities
- Product definition, interface design and the full design system.
- Expo React Native app with MapLibre rendering and native map optimizations.
- Go backend services for events, presence, membership and notifications.
- Geospatial data model on PostgreSQL + PostGIS with H3 cell indexing.
- Real-time layer on Redis and NATS; store, fan-out and reconciliation logic.
- RevenueCat subscription integration and membership entitlement architecture.
Architecture
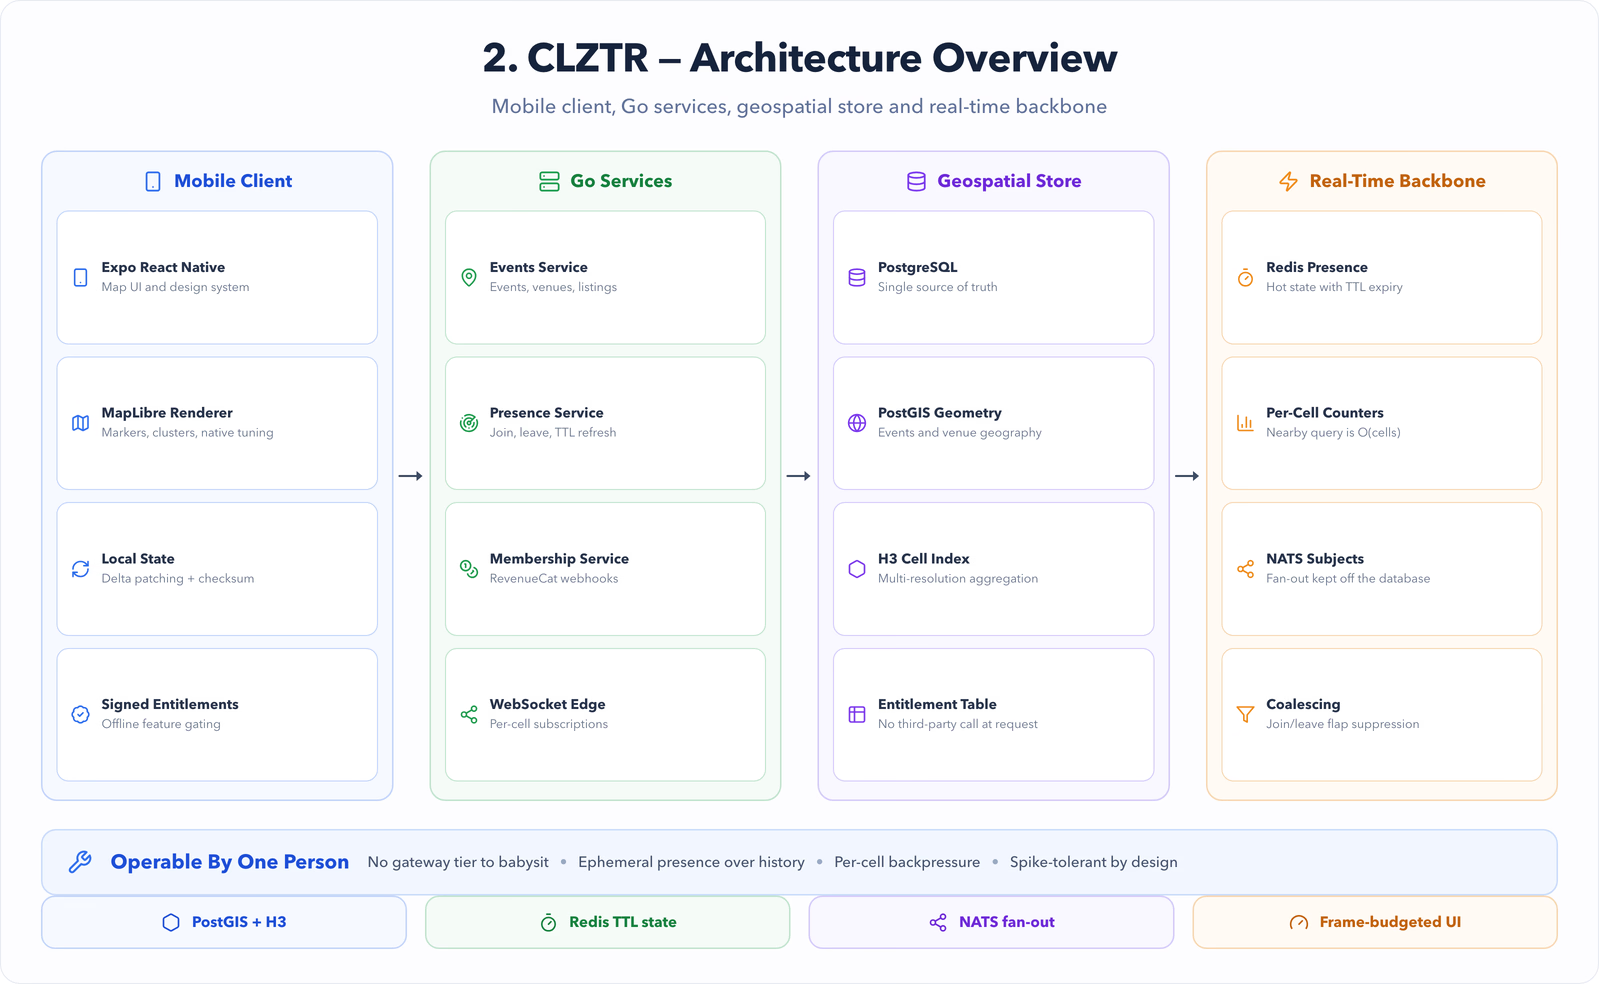
- An Expo React Native client talks to a small set of Go services over HTTP and WebSockets — no gateway layer a solo operator would have to babysit.
- PostgreSQL + PostGIS is the source of truth; every event and venue is indexed into H3 cells at multiple resolutions for fast viewport aggregation.
- Redis holds hot presence state and per-cell aggregate counters with TTL-based expiry, so a crashed client disappears from the map on its own.
- NATS distributes presence and event mutations between services and WebSocket edge processes, keeping fan-out off the database.
- Membership entitlements resolve through RevenueCat webhooks into a local entitlement table, so feature gates never require a synchronous third-party call.
Key decisions
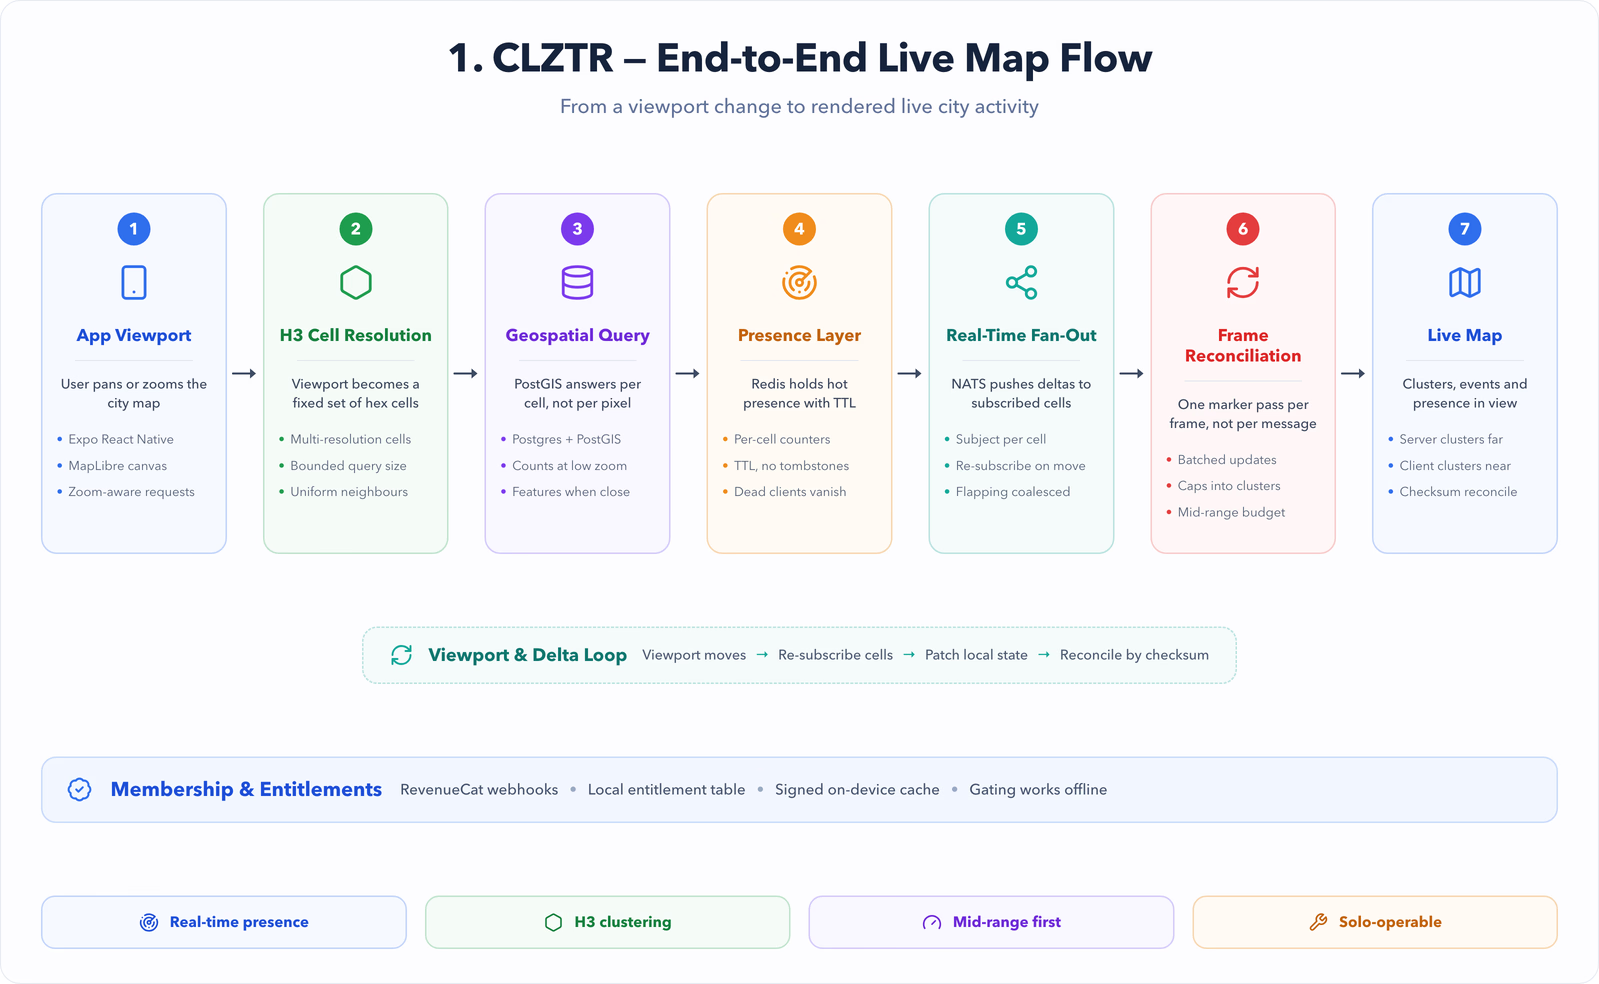
- H3 over ad-hoc geohashing: hexagonal cells give uniform neighbor distances, which makes clustering visually honest and viewport queries a fixed set of cell lookups.
- Server-side clustering at low zooms, client-side at high zooms: the phone only ever receives what it can afford to render.
- Presence is ephemeral by design — Redis TTLs instead of tombstone writes — trading perfect history for operational simplicity.
- Go over Node for services: predictable memory under sustained WebSocket load mattered more than sharing types with the client.
Implementation
- Viewport queries resolve to H3 cell sets; responses are aggregate counts per cell at low zoom and full features only inside the visible cells at high zoom.
- The map pipeline batches marker updates into a single reconciliation pass per frame instead of reacting to every socket message.
- WebSocket sessions subscribe to the NATS subjects for their current cells only, and re-subscribe as the viewport moves.
- Event writes publish deltas; clients patch local state and periodically reconcile against a checksum to catch drift.
- Membership state is cached on-device with signed entitlements so gating works offline.
Performance
- Marker rendering stays on the UI thread's budget by capping visible features and promoting the rest into cluster aggregates.
- Per-cell Redis counters make the 'what is nearby' query O(cells in viewport), independent of total event volume.
- Presence fan-out is coalesced: rapid join/leave flapping within a window collapses into one message.
- Cold-start map paint was profiled and tuned on low-end Android hardware, not the simulator.
Outcomes
- Runs in production with real users discovering live events on the map.
- The geospatial architecture has absorbed large-event spikes without structural changes.
- Membership infrastructure supports paid tiers without any synchronous third-party dependency at request time.
- [PLACEHOLDER — add real usage and growth metrics here when publishable.]
Lessons
- Real-time features earn their complexity only where users can see them — presence yes, silent metadata no.
- Designing for the mid-range device first made every later optimization cheaper.
- As a founder, the architecture you can operate alone at 2am is the correct one.
Software Architecture